How to make your putting distance more consistent: measure your spread as a percentage, then remove the causes one by one
- Distance & pace
Your 3 m putts mostly finish close, but from 10 m you leave one 2 m short and send the next one 2 m past. The feel for distance you had yesterday has gone today. Most distance problems are not about aiming at the wrong spot. They are about results that scatter from one putt to the next.
The relationship between stroke length and distance itself (double the backswing and the ball goes four times as far) is explained in "Putting distance control comes from stroke length". This article follows on from it and looks at the spread you get when you hit the same putt again and again. Using the same physics model as the Putt Stroke Simulator, it separates the causes of that spread one at a time, shows which fix pays off most, and explains how to measure your own spread. Data and practice methods published on golf websites in Japan and abroad since 2024 are included, with their sources.
The short version
| Situation | What to think about |
|---|---|
| Measuring your spread | Hit 10 balls the same distance and take (longest − shortest) ÷ 3 as your spread. Divide by the distance to get a percentage |
| Target | Good tour players stop about three quarters of their long putts within ±10% of the distance. Aim first to get your spread under ±15% |
| Short putts (up to 3 m) | Most of the spread comes from stroke length. Practise checking the length by eye |
| Long putts (8 m and more) | Most of the spread comes from tempo. Swing at the same tempo for every distance |
| Off-centre strikes | Heel–toe misses of around ±8 mm add only about 2% to the distance spread. Low priority |
| Strokes saved over 18 holes | Halve the spread and save about 1.4 as a strong amateur, about 2.4 as an average amateur and 3 or more as a high handicapper |
| Too many short, or too many long | That is not spread but a bias. Change where you aim and it goes away |
Distance errors grow in proportion to distance
The first thing to understand is that the spread in distance gets bigger as the putt gets longer. A player who misses by 30 cm from 3 m will miss by around 1 m from 10 m.
An analysis by PGA Professional Philip Dye (PGA) gives these figures for long putts by tour players:
- In statistician Lou Stagner's data, about 90% of elite lag putts finish within ±30% of the starting distance
- By Alex Huang's standard, beyond 25 feet (about 7.6 m) good players stop about 75% of putts within ±10%. About half of 30-foot putts finish short
- At the 2025 U.S. Open (Oakmont), the ten best putters in the field stopped 77% of their first putts within ±10%, with a three-putt rate of 10%. The field average was 17%
All of these are expressed as a percentage of the distance. Physics explains why. The distance the ball rolls is proportional to the square of its starting speed. So if the starting speed varies by 5%, the distance varies by about 10%, whether the putt is 10 m or 3 m. The same 10% is 30 cm from 3 m and 1 m from 10 m.
Amateurs' three-putts also come mostly from this spread. Data from the shot-tracking service Shot Scope (MyGolfSpy, April 2025) shows one three-putt every 16.7 holes at a 5 handicap, every 9.7 holes at 15 and every 7.6 holes at 25. Per round, that is roughly 1, 2 and 2.4.
What spread do you need to finish within 1 m?
So how far do you need to cut the spread before your putts start finishing close? Expressing the spread in distance (the standard deviation) as a percentage of the distance aimed for, I calculated the share of putts that stop within 1 m short or long of the hole (direction errors are not included).
| Spread | 5 m | 8 m | 10 m | 15 m |
|---|---|---|---|---|
| ±5% | 100% | 99% | 95% | 82% |
| ±10% | 95% | 79% | 68% | 50% |
| ±15% | 82% | 60% | 50% | 34% |
| ±20% | 68% | 47% | 38% | 26% |
With a spread of ±10%, about 70% of 10 m putts finish within 1 m. At ±20%, that drops below 40%. Cutting the spread from 20% to 10% makes you about 1.8 times as likely to get a 10 m putt within 1 m. From inside 1 m the second putt nearly always drops, so three-putts fall by the same amount.
Separating the causes of the spread
Within the stroke, there are three main reasons the distance changes from one putt to the next:
- Stroke length: the backswing is a little different every time
- Tempo: the speed of the swing is a little different every time
- Strike: the ball is struck off the sweet spot, towards the heel or toe
I calculated how much each one scatters the distance. As a spread that seems typical for amateurs, I assumed stroke length ±2 cm, tempo ±5% and strike ±8 mm, and hit 3,000 putts for each case, varying one cause at a time or all of them together (Stimp 10, blade putter). The figures in the table are the spread of where the ball stops (standard deviation, in cm).
| Cause | 1 m | 3 m | 6 m | 10 m |
|---|---|---|---|---|
| Stroke length ±2 cm only | ±27 | ±47 | ±66 | ±85 |
| Tempo ±5% only | ±11 | ±31 | ±62 | ±105 |
| Strike ±8 mm only | ±2 | ±5 | ±11 | ±18 |
| All three | ±29 | ±56 | ±92 | ±133 |
The table shows three things.
- On short putts, stroke length is the main culprit. On a 1 m putt, a 2 cm difference in backswing changes the distance by close to 30%. The backswing needed is only 15 cm, so 2 cm is a large share of it
- On long putts, tempo is the main culprit. Tempo errors act as the same share (about 10%) at every distance, so in centimetres they grow as the putt gets longer. From 10 m, tempo matters more than stroke length
- Heel–toe misses are small. A spread of around 8 mm off centre adds only about 2% to the distance spread. A big miss (2 cm) costs 8% on that one putt, but that is better treated separately as an occasional large mistake
Adding all three together is not simple addition. Spreads combine as the square root of the sum of their squares, so reducing the largest cause pays off most. However much you fix a small cause (the strike), the total spread barely changes.
Which fix pays off most
Under the same conditions, here is the share of putts that stop within 1 m short or long of the hole as tempo and then stroke length are made steadier.
| Stroke | 3 m | 6 m | 10 m | 15 m |
|---|---|---|---|---|
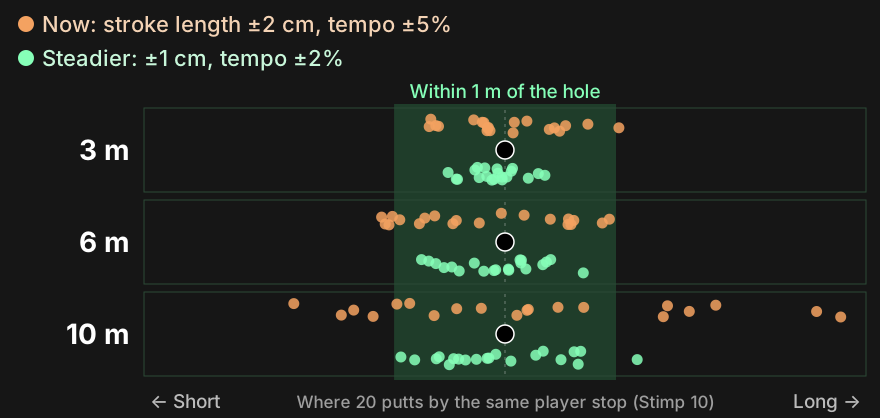
| Now (length ±2 cm, tempo ±5%) | 93% | 72% | 55% | 40% |
| Tempo steadied to ±2% | 95% | 83% | 70% | 57% |
| Length also steadied to ±1 cm | 100% | 98% | 89% | 77% |
Steadying the tempo alone raises the share of 10 m and 15 m putts that finish within 1 m by more than 15 points. Steady the length as well and nearly 90% of 10 m putts stop within 1 m. The image at the top of the article shows 20 putts each from the "now" and "both steadied" rows.
Practise in this order: tempo, then stroke length. If the tempo changes every time, the distance will not match however precise the length is. If the tempo is steady, distance depends only on length, and work on the length shows up directly in the results.
How many strokes over 18 holes?
So how many strokes a round does a smaller spread save? I calculated it under representative conditions for three levels of player: strong amateurs, average amateurs and high handicappers.
- How close the short game finishes varies a lot by level. In Shot Scope's data (MyGolfSpy, October 2025), the average proximity from inside 50 yards is 14 feet (about 4.3 m) at a 5 handicap, 18 feet (about 5.5 m) at 15 and 22 feet (about 6.7 m) at 25. I used these as averages and spread them out, from balls that finish 1 m away to ones that leave 15 m or more
- On greens hit in regulation the first putt averages 9 m, 11 m and 13 m, with 9, 5 and 2.5 greens in regulation
- The chance of holing a putt uses Shot Scope's real data by handicap (MyGolfSpy, August 2025). From 3–6 feet (about 1–2 m), for example, it is 67% at a 5 handicap, 59% at 15 and 48% at 25
- Better pace also holes more putts, and this is included. Even on the right line, a ball that comes up short, or is hit hard enough to run more than 1.2 m past, does not drop. With less spread, more balls arrive at a pace that can go in
- The current spread is assumed to be ±10% for strong amateurs, ±15% for average amateurs and ±20% for high handicappers (±25% for those who three-putt a lot)
| Level | Current spread | Cut by 30% | Halved |
|---|---|---|---|
| Strong amateur (around 5 hcp) | ±10% | about 0.9 | about 1.4 |
| Average amateur (around 15 hcp) | ±15% | about 1.4 | about 2.4 |
| High handicapper (around 25 hcp) | ±20% | about 1.9 | about 3.2 |
| High handicapper who three-putts a lot | ±25% | about 2.3 | about 3.9 |
The figures are strokes saved over 18 holes. "Cut by 30%" roughly matches "Tempo steadied" in the previous table, and "Halved" roughly matches "Length also steadied" (the spread from 10 m falls from ±133 cm to ±96 cm and to ±60 cm).
- For a high handicapper, halving the spread saves more than 3 strokes a round. Steadying the tempo alone saves about 2
- The saving comes from fewer three-putts and more one-putts. For a high handicapper (±20%), halving the spread cuts three-putts from about 5.8 to about 3.8 a round and raises one-putts from about 2.2 to about 3.1
- The bigger your spread, the more strokes you save. The less close your short game finishes and the longer the putts you leave, the more distance control shows up in your score
The three-putt counts in this calculation (with the current spread, about 1.9 for strong amateurs, 3.6 for average amateurs and 5.8 for high handicappers) are higher than Shot Scope's averages (MyGolfSpy, April 2025: about 1.1, 1.9 and 2.4). In other words, the table describes players for whom distance control on long putts is a weakness. If you three-putt less than average, expect to save fewer strokes than the table shows. Count your three-putts in a round and look at the closest row.
Steadying the tempo
Use a metronome
A metronome is a common recommendation from coaches abroad for keeping tempo constant.
- In GOLF Top 100 Teacher Joey Wuertemberger's "8-4-4 drill" (GOLF.com, January 2025), the metronome is set to 76–84 bpm: start on beat one, reach the top on beat two and strike on beat three
- The Spin Axis podcast (August 2025) says that swinging to a metronome makes the flaws in your rhythm obvious
- PGA Professional Brendon Elliott (GolfWRX, October 2024) also recommends keeping a consistent tempo so that the only thing that changes with distance is stroke length
Your tempo can be different from anyone else's. What matters is that you swing at the same tempo from 1 m and from 10 m. Once you find a tempo on a metronome app that feels comfortable, use the same setting every time you practise.
Use a favourite song instead of a metronome
If you don't have a metronome to hand, you can play a song at the right tempo in your head, or hum it. The songs below are all close to 76–84 bpm (or double that).
| Song | Artist | Tempo |
|---|---|---|
| We Will Rock You | Queen | 81 bpm |
| Halo | Beyoncé | 80 bpm |
| Hello | Adele | 80 bpm |
| Thinking Out Loud | Ed Sheeran | 79 bpm |
| Shake It Off | Taylor Swift | 160 bpm (80 counting every other beat) |
| Crazy Little Thing Called Love | Queen | 156 bpm (78 counting every other beat) |
The tempos come from song databases such as SongBPM, and from an article by guitarist Mike Outram on remembering tempos through songs (a list of Queen songs). Different recordings can differ by 1–2 bpm.
Use it the same way as the 8-4-4 drill: start on beat one, reach the top on beat two and strike on beat three. For a 160 bpm song, count every two beats as one. With "We Will Rock You", the stroke fits straight onto the "stomp, stomp, clap".
Using songs as a tempo cue in golf has been suggested elsewhere too. PGA Professional Brendon Elliott lists songs at 63–75 bpm (such as Bill Withers' "Ain't No Sunshine" at 75 bpm) for building full-swing tempo (Mileseey, February 2026). For putting, a little faster, 76–84 bpm, is the guide.
Tour players' putting tempo, by the way, is measured with a backswing that takes about twice as long as the forward swing (a ratio of 1.9–2.1) (Trackman, updated August 2025). That ratio differs from counting one beat per phase, but what matters is not the ratio itself but that it is the same every time. Choose whichever way of counting you find easiest to keep steady.
Don't accelerate into impact
The old advice to "accelerate through the ball" is said to be a common cause of uneven rhythm.
- World-renowned putting coach Phil Kenyon recommends accelerating early in the forward stroke and then letting the putter coast into the ball (Golf Digest, March 2026). He also describes a check: put a coin on the back of the putter and swing; if it slides off near impact, the acceleration is coming too late
- The Spin Axis podcast also names a common fault: taking the putter back too slowly, running out of time, and then hitting at the ball
In the physics model too, a stroke that keeps accelerating, with the same length and the same time, gives a head speed at impact about 1.3 times that of a pendulum swing (see the appendix to the earlier article). If the amount of acceleration changes from putt to putt, that change goes straight into the distance spread. Letting the putter fall naturally from the top and strike the ball, like a pendulum, keeps the speed the same every time.
Steadying the stroke length
Use a marker and check the length by eye
Matching stroke length by feel alone is hard, so in practice put a marker behind the ball. Note that the head sits a little above the ground and rises as you take it back, so against the marker your backswing looks slightly longer than it is. At 20 cm the difference is about 7 mm, but at 40 cm it is about 3 cm (skeleton-model calculation). On longer strokes, taking it back a touch past the marker is about right.
- In the 8-4-4 drill you push a tee in 8 inches (about 20 cm) behind the ball, take the putter back to it and hit 10 putts. On a flat green, the ball should roll about 10 feet (3 m)
- For every extra 10 feet (about 3 m), the stroke gets 4 inches (about 10 cm) longer
It is easy to remember, but by the physics model at the same tempo distance grows with the square of the stroke length, so a player who rolls the ball 3 m with 20 cm will roll it about 7 m with 30 cm and about 12 m with 40 cm (the drill assumes 6 m and 9 m). Treat the 8-4-4 numbers as a starting point, measure how far the ball actually rolls, and build your own table of stroke length against distance. How to build it is covered under "Backswing guide: 1 m, 4 m, 9 m" in "Putting distance control comes from stroke length".
Especially on putts of about 1 m
The shorter the putt, the larger the share a 1–2 cm difference in stroke length makes. If your pace on 1 m putts is unreliable, put two tees down (one for the backswing and one for the follow-through) and practise checking that the length is always the same.
Building a picture of the distance
Even with a steady stroke, the results will scatter if your picture of how hard to hit it changes every time.
- Putting coach Satoshi Hirata recommends rolling the ball by hand, without a putter (Minna no Golf Digest, August 2025). Picture the ball rolling to a target 2–5 m away, roll it by hand and check the result. It trains the loop of "see, picture, execute, check" without any stroke technique involved
- Brendon Elliott's "ladder drill" puts markers every 5 feet from 15 to 50 feet; you move on to the next distance only when a ball stops within 3 feet (about 90 cm) of the hole. Because the distance changes with every putt, it builds the picture in a way close to real play
If you hit the same distance many times in a row, from the second ball on you can adjust by watching the previous one. To really reduce the spread, it is important to mix in practice where the distance changes with every ball.
Measuring your own spread
Finally, here is how to measure your spread as a percentage. It takes ten minutes on the practice green.
- On a flat area, put a tee or coin 6 m away (don't use a hole)
- Using your normal routine, hit 10 balls and measure how many centimetres short or long of the target each one stops (one putter length is about 85 cm)
- Work out the average of the 10. This is your bias. If it is negative, you tend to leave it short
- Divide the difference between the longest and the shortest ball by 3. This is a rough value for your spread (standard deviation)
- Divide the spread by 6 m to get a percentage
For example, if the shortest of the 10 balls stops 90 cm short of the target and the longest 60 cm past, the difference is 150 cm and the spread is 50 cm, about 8% of 6 m. At that level you would get about 80% of 10 m putts within 1 m.
Bias and spread are fixed in completely different ways.
- Bias (the average leaning short or long) goes away when you change where you aim. For how far past the hole to aim, see "Is "17 inches past" really the best pace?"
- Spread does not change when you change the aim. The only fix is a steadier tempo and stroke length
Measure the same way about once a month and you can see the effect of your practice in numbers. Measure from 3 m and 10 m as well, and you can tell whether you scatter on short putts (a stroke length problem) or on long ones (a tempo problem).
Find your weak point with the simulator
In the Putt Stroke Simulator you can move stroke length, period (tempo) and strike point one at a time and see how the roll distance changes. With your own stroke length and period entered,
- move the stroke length by ±1 cm
- move the period by ±5% (1.14–1.26 s if it is 1.2 s)
and you will see how many centimetres each one changes the distance. Whichever changes it more is the one to steady first. You can find your period by filming in slow motion on a smartphone, timing the move from the top to impact and multiplying by four.
Misjudge the green speed and every ball is off
Even with a steady stroke, misjudging the speed of the day's greens sends every ball off in the same direction. In the physics model, playing a Stimp 11 green as if it were Stimp 10 sends the ball about 8% long at every distance. That is a bias, not a spread, so you can fix it on the practice green before you tee off.
Before a round, hit a few balls of around 5 m on a flat spot and check how far your usual stroke length rolls the ball. How to think about green speed is covered in "What is a Stimpmeter? Green speed explained with physics".
Summary
- Distance errors grow in proportion to distance. Think of the spread as a percentage of the distance
- Good tour players stop about three quarters of their long putts within ±10%. Cutting your spread from 20% to 10% makes you about 1.8 times as likely to get a 10 m putt within 1 m
- Spread on short putts comes from stroke length, and spread on long putts from tempo. Heel–toe misses matter little
- Fix them in the order tempo, then stroke length. Use a metronome and swing at the same tempo for every distance. Don't accelerate into impact
- Hit 10 balls and use (longest − shortest) ÷ 3 to measure your spread. Fix the average bias with your aim and the spread with your stroke
- Halving the spread saves about 1.4 strokes over 18 holes for a strong amateur, 2.4 for an average amateur and 3.2 for a high handicapper, through fewer three-putts and more one-putts
- Misjudging the green speed is a bias. Match it on the practice green before you start
Appendix: the calculations
Why the distance spread stays constant as a percentage
As in the appendix to the earlier article, for a pendulum stroke with stroke length A and period T, the roll distance D is
D ∝ (A / T)²
The effect of a small error in each on distance is
ΔD / D ≒ 2 ΔA / A − 2 ΔT / T
A tempo error ΔT / T happens as the same share at every distance, so the distance error is also the same share (twice as large). A player whose tempo varies by ±5% has a distance spread of ±10%.
Stroke length errors, on the other hand, tend to happen as a length, such as ±2 cm, so ΔA / A is larger on short putts, where the needed stroke length A is small. At 1 m (A ≈ 15 cm), 2 cm is 13%; at 10 m (A ≈ 47 cm), it is 4%. This is why stroke length is the main cause on short putts and tempo on long putts.
How spreads combine
When causes vary independently, the total spread σ is the square root of the sum of the squares of each spread.
σ_total = √( σ_length² + σ_tempo² + σ_strike² )
From 10 m, for example, √(85² + 105² + 18²) ≈ 136 cm, almost the same as the result of varying all three at once (133 cm). Even setting the strike (18 cm) to zero gives √(85² + 105²) ≈ 135 cm, hardly any change. That reducing the largest cause pays off most follows from this formula.
The share that stops within 1 m
If the distance error follows a normal distribution with mean 0 and standard deviation σ, the share that stops within r short or long of the hole is
P = erf( r / (√2 σ) )
The table "What spread do you need" in the main text uses σ = spread (%) × distance and r = 1 m. The table "Which fix pays off most" does not use this formula; it counts the results of 3,000 putts in the physics model.
Strokes saved over 18 holes
With a first putt of length L and a holing rate at that distance (Shot Scope's value) of p₀(L), the expected number of putts on one hole is
putts = 1 + (1 − p(L)) × E[ 1 + (1 − p(d)) × (1 + (1 − p₀(0.4 m))) ]
Here d is the distance left after a missed first putt: the distance error (on average 0.4 m long, standard deviation = spread × L) combined with a sideways error (standard deviation = 4%, 5% and 6% of L). The third putt is taken as 0.4 m.
When the spread changes, the holing rate p is corrected by the ratio of putts that arrive at a pace that can drop.
p(L) = p₀(L) × W(σ L) / W(σ₀ L)
W(s) = Φ((1.2 − 0.4) / s) − Φ((0 − 0.4) / s)
σ₀ is the current spread, σ the reduced spread and Φ the cumulative distribution function of the standard normal distribution. This is a simple view in which a putt drops if it is struck to stop 0–1.2 m past the hole; 0.4 m is the target pace ("17 inches past"). p₀ uses Shot Scope's value for each distance band, interpolated linearly between band midpoints.
First putts follow a log-normal distribution: after the short game, averages of 4.3 m, 5.5 m and 6.7 m (coefficient of variation 0.8); after a green in regulation, 9 m, 11 m and 13 m (coefficient of variation 0.6). Adding up 18 holes and changing only the spread gives the "strokes saved". The result depends on these assumptions, so read the table as a guide.
Estimating the spread from 10 balls
When you draw 10 values from a normal distribution, the expected difference between the largest and smallest is about 3.08 times the standard deviation. So (longest − shortest) ÷ 3 gives a rough value for the standard deviation. With only 10 balls the estimate is rough (about ±25%), so averaging several sessions is more reliable.
Conditions: this site's physics model (head speed from a pendulum stroke, head–ball collision solved in three dimensions, then hop, skid and pure roll until the ball stops). Putter: blade (345 g head, MOI 4,000 g·cm², coefficient of restitution 0.85, loft 3°), period 1.2 s, Stimp 10, flat, no grain. Stroke length, period and strike point (heel–toe) were varied with normal distributions, and 3,000 putts were computed for each case. The sizes of the spreads (such as ±2 cm in stroke length) are assumptions for illustration, not measurements.
Sources: PGA (Philip Dye's analysis of lag putting), MyGolfSpy (Shot Scope three-putt data, April 2025), MyGolfSpy (Shot Scope make percentages by handicap, August 2025), MyGolfSpy (Shot Scope short-game proximity by handicap, October 2025), GOLF.com (the 8-4-4 drill, January 2025), GolfWRX (lag putting tips and the ladder drill, October 2024), Golf Digest (Phil Kenyon's three principles, March 2026), The Spin Axis (distance control and acceleration at impact, August 2025), Minna no Golf Digest (rolling the ball by hand, August 2025), Mileseey (using song tempo to groove your swing, February 2026), Trackman (definition of putting tempo, updated August 2025).